Advertisement
When most people think of data analysis, the first languages that come to mind are usually Python or R, and for good reason. They've been around for a while, they have huge communities, and they get the job done. But then there's Julia. Sleek, efficient, and built with performance in mind, Julia isn't just another option—it's a language that's quietly reshaping how data scientists think about speed, clarity, and scalability. If you're curious about what makes Julia tick, you're in the right place.
Unlike Python or R, which are interpreted languages and can slow down when crunching large datasets or running nested loops, Julia was designed for high performance from the start. It’s compiled, meaning it translates code directly into machine language, allowing for significantly quicker execution.
That doesn’t mean Julia is tough to write, though. In fact, Julia looks surprisingly readable. If you’ve used Python before, you won’t be thrown off. Functions are defined with the function keyword, indexing starts at 1 (a twist, yes, but easy to get used to), and you’ll notice that operations on arrays or matrices feel almost natural.
But here’s the most attractive part—Julia combines the ease of writing code that’s intuitive with the power of near-C performance. This unique balance is why many researchers and data professionals are starting to experiment with it for complex numerical tasks.
Julia isn’t just a fast language; it comes with a growing set of tools that make it suitable for serious data analysis. If you're stepping into Julia for the first time, here are the essentials you’ll encounter early on:

If you’ve used pandas in Python, this will feel familiar. DataFrames.jl is Julia’s go-to package for working with tabular data. You can sort, filter, join, and group data with syntax that’s logical and flexible. And yes, it’s fast—especially when you’re dealing with larger-than-usual datasets.
One neat detail is how Julia allows you to work with data using a combination of functional and pipe-based syntax. So, if you're someone who likes chaining commands to keep the code neat and readable, you're covered.
Loading CSV files is a common first step in any data analysis project, and CSV.jl makes that simple. It’s lightweight, fast, and works seamlessly with DataFrames.jl. Whether you’re importing a small table or something with millions of rows, the speed difference is noticeable compared to traditional tools.
Data visualization in Julia can be handled through several packages, but StatsPlots.jl is a practical choice for statistical graphics. Built on top of Plots.jl, it provides clear, ready-to-go visualizations without much setup. Think histograms, scatter plots, box plots—the usual suspects, done quickly.
This one’s a gem if you like SQL-style data manipulation. Query.jl lets you filter, project, join, and group data using a syntax that reads almost like a sentence. While not everyone will prefer this style, it offers another route to tidy, readable data wrangling.
Ready to try it out? Here's how you can get started without going in circles. Just follow these steps, and you'll have your environment ready to analyze data with Julia.
First things first—grab Julia from the official website. Installation is straightforward. Pick the version for your operating system, download, and install it just like you would any other software.
While you can use the default Julia REPL (command-line interface), most people prefer a graphical interface. Juno (based on Atom) was once popular, but today, the clear winner is the Julia extension for VS Code. It’s smooth, has autocomplete, and works great with plotting libraries.

Once you're in, open the Julia REPL and run:
julia
CopyEdit
using Pkg
Pkg.add("DataFrames")
Pkg.add("CSV")
Pkg.add("StatsPlots")
Pkg.add("Query")
This sets up the basic tools we discussed earlier. You can add more as you go, but this will get your analysis going.
With your packages installed, it’s time to pull in your data:
julia
CopyEdit
using CSV, DataFrames
df = CSV.read("yourfile.csv", DataFrame)
Simple as that. Your data’s now in a usable format.
Let’s say you want to check the average of a column called sales:
julia
CopyEdit
mean(df.sales)
Or maybe group by a category and calculate something:
julia
CopyEdit
using Statistics
combine(groupby(df, :region), :sales => mean)
You’ll start to notice how concise and quick the operations are.
Bring in the plots:
julia
CopyEdit
using StatsPlots
@df df scatter(:region, :sales)
That’s a basic example, but it gives you a sense of how clean the syntax is. There’s no excessive setup, no long function chains to remember—just what you need.
Julia might not be the first tool you reach for when plotting a bar chart or filtering a dozen rows. But when your work starts leaning into performance-heavy territory—think simulations, numerical modeling, or analysis on millions of records—that’s when Julia shines. It's built to handle those situations without you rewriting half your code in another language just to speed it up.
Another big point is interoperability. Julia doesn’t lock you in. You can call Python, R, or even C code from within your Julia session. So, if you have existing tools that work great in Python but want to run simulations in Julia, you don’t have to pick sides. Julia plays well with others.
Julia is a modern, high-speed language with a clear focus: to make complex numerical computing easier and faster. It borrows the best ideas from other languages but avoids the usual tradeoffs. If you're a data analyst or researcher looking for something faster, cleaner, and more scalable, it's absolutely worth your time.
Sure, the ecosystem is still growing, and some packages might not be as polished as what you’re used to in Python or R. But the core is solid, and the pace of development is encouraging. If nothing else, learning Julia gives you another tool in your belt—and one that's particularly good when your projects outgrow your usual environment.
Advertisement

Discover how Google BigQuery revolutionizes data analytics with its serverless architecture, fast performance, and versatile features
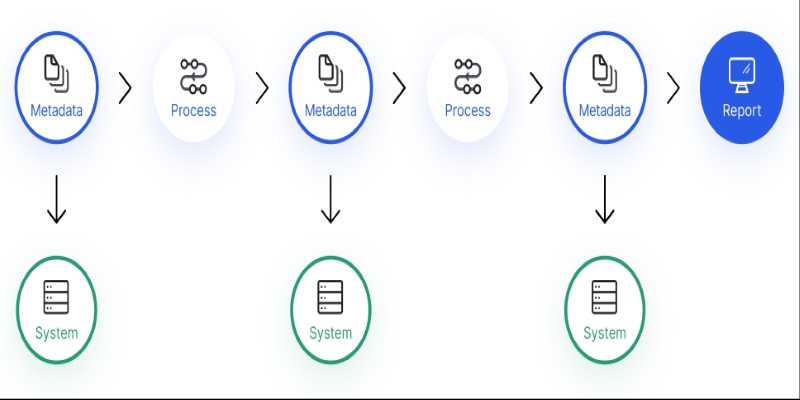
Confused about where your data comes from? Discover how data lineage tracks every step of your data’s journey—from origin to dashboard—so teams can troubleshoot fast and build trust in every number

Improve automatic speech recognition accuracy by boosting Wav2Vec2 with an n-gram language model using Transformers and pyctcdecode. Learn how shallow fusion enhances transcription quality
How accelerated inference using Optimum and Transformers pipelines can significantly improve model speed and efficiency across AI tasks. Learn how to streamline deployment with real-world gains
Curious how to build your first serverless function? Follow this hands-on AWS Lambda tutorial to create, test, and deploy a Python Lambda—from setup to CloudWatch monitoring
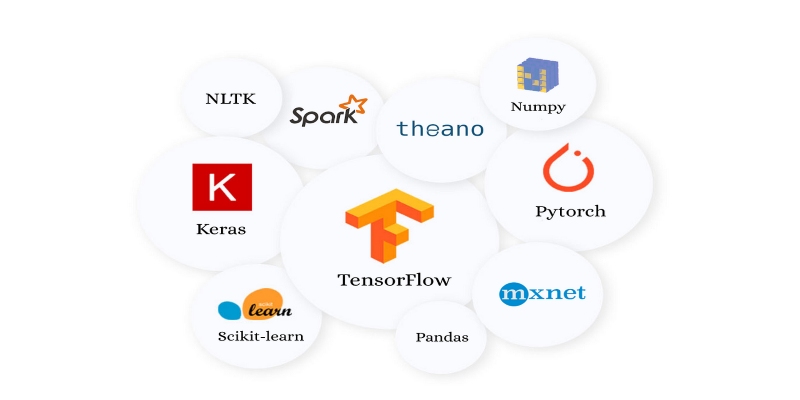
Looking for the next big thing in Python development? Explore upcoming libraries like PyScript, TensorFlow Quantum, FastAPI 2.0, and more that will redefine how you build and deploy systems in 2025
Are you running into frustrating bugs with PyTorch? Discover the common mistakes developers make and learn how to avoid them for smoother machine learning projects

How to train large-scale language models using Megatron-LM with step-by-step guidance on setup, data preparation, and distributed training. Ideal for developers and researchers working on scalable NLP systems
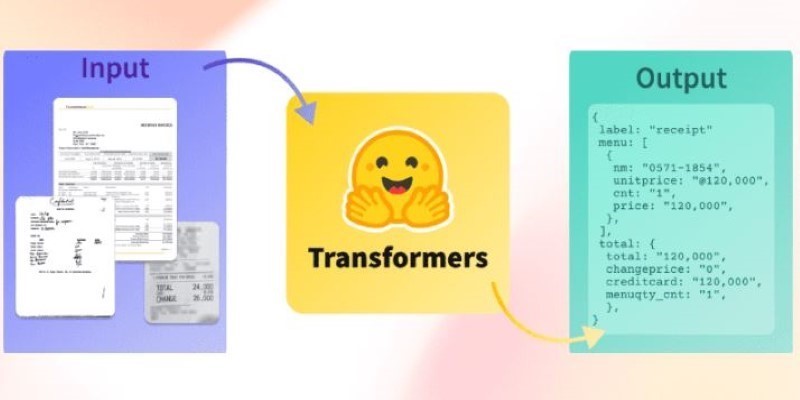
How Sempre Health is accelerating its ML roadmap with the help of the Expert Acceleration Program, improving model deployment, patient outcomes, and internal efficiency

Confused about DAO and DTO in Python? Learn how these simple patterns can clean up your code, reduce duplication, and improve long-term maintainability

The Hugging Face Fellowship Program offers early-career developers paid opportunities, mentorship, and real project work to help them grow within the inclusive AI community
How Summer at Hugging Face brings new contributors, open-source collaboration, and creative model development to life while energizing the AI community worldwide