Advertisement
If you've ever wondered how search engines seem to "just know" what you're asking, even when you're being vague, there's something working in the background doing the heavy lifting. It's not magic. Its structure. And more specifically, it's the quiet but clever architecture of knowledge graphs. Though the term may sound a bit academic, the way it functions is surprisingly grounded.
Think of a traditional database. It's organized, sure, but rigid. Everything is in a row or column. If you want to find out how one thing connects to another, you usually have to hop through hoops, like scanning multiple tables or linking keys manually. That's fine when you know exactly what you're looking for. But what if you only know a little? What if your query is messy?
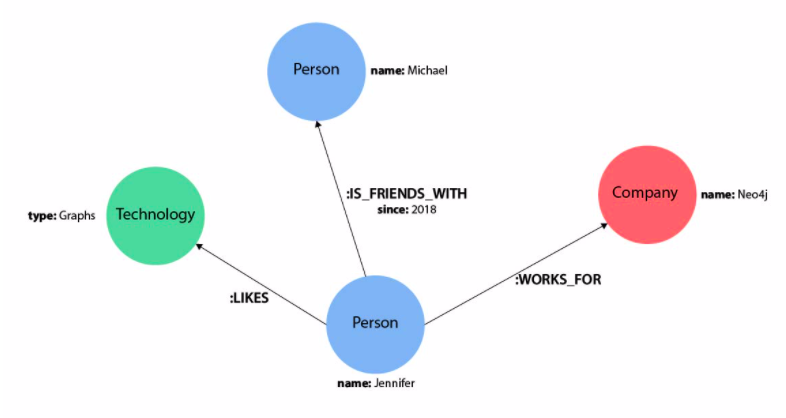
This is where knowledge graphs stand out. Rather than storing information in isolated buckets, they focus on how everything connects. “Leonardo da Vinci” isn’t just a name in a cell. He’s connected to “Mona Lisa,” “Renaissance,” “Italy,” and “inventions.” Each of those concepts has its own set of links, weaving an intricate mesh of understanding that lets systems see beyond a flat list.
That’s the core idea: entities and their relationships. Not just who or what something is, but how it links to everything else. It’s the web, but with meaning built in.
To keep it simple, a knowledge graph is made up of nodes and edges. Nodes represent entities (like people, places, concepts), and edges represent the relationships between them.
For example:
Now, scale that up to billions of nodes and relationships. That’s what you’re dealing with in a full-fledged knowledge graph.
What makes this structure helpful isn’t just its size—it’s the semantics behind it. The system understands that “Tesla” is a company, not a scientist, because of its place in the web of relationships. It understands that “Apple” could mean fruit or tech company, depending on context. That’s not something you get out of basic keyword searches.
And the data isn’t just floating around. It comes with context, defined by ontologies and schemas that help organize meaning. In short, it’s not only about knowing things—it’s about understanding them in relation to one another.
There’s a reason why companies like Google, Facebook, and Amazon rely on these structures—they make information useful. Not just accessible, but actionable.
Search: When you type a question into Google, the search engine isn’t just looking at words. It’s pulling in entities and mapping out the intent behind your query. It knows that “best novels by Orwell” links George Orwell to a list of books, which are ranked, reviewed, and detailed somewhere else.
Recommendations: Streaming platforms use similar setups. If you watched “Inception,” a system doesn’t just recommend similar genres. It tracks patterns—actors, directors, themes—and finds matches in a web of connected data.
Fraud Detection: Financial institutions analyze transaction patterns using knowledge graphs. A single transfer might not raise eyebrows. But a series of transfers, connected through shell companies or aliases? That’s the kind of pattern knowledge graphs are designed to spot.
Internal Tools: Even within companies, knowledge graphs can map out who works on what, what tools they use, and where information lives. It turns scattered documentation into something navigable.
In all these cases, it’s not about having more data. It’s about having smarter data—data that connects, informs, and adapts.
Creating a knowledge graph isn’t just about tossing data into a new format. It’s a deliberate process that combines structure, logic, and clarity.
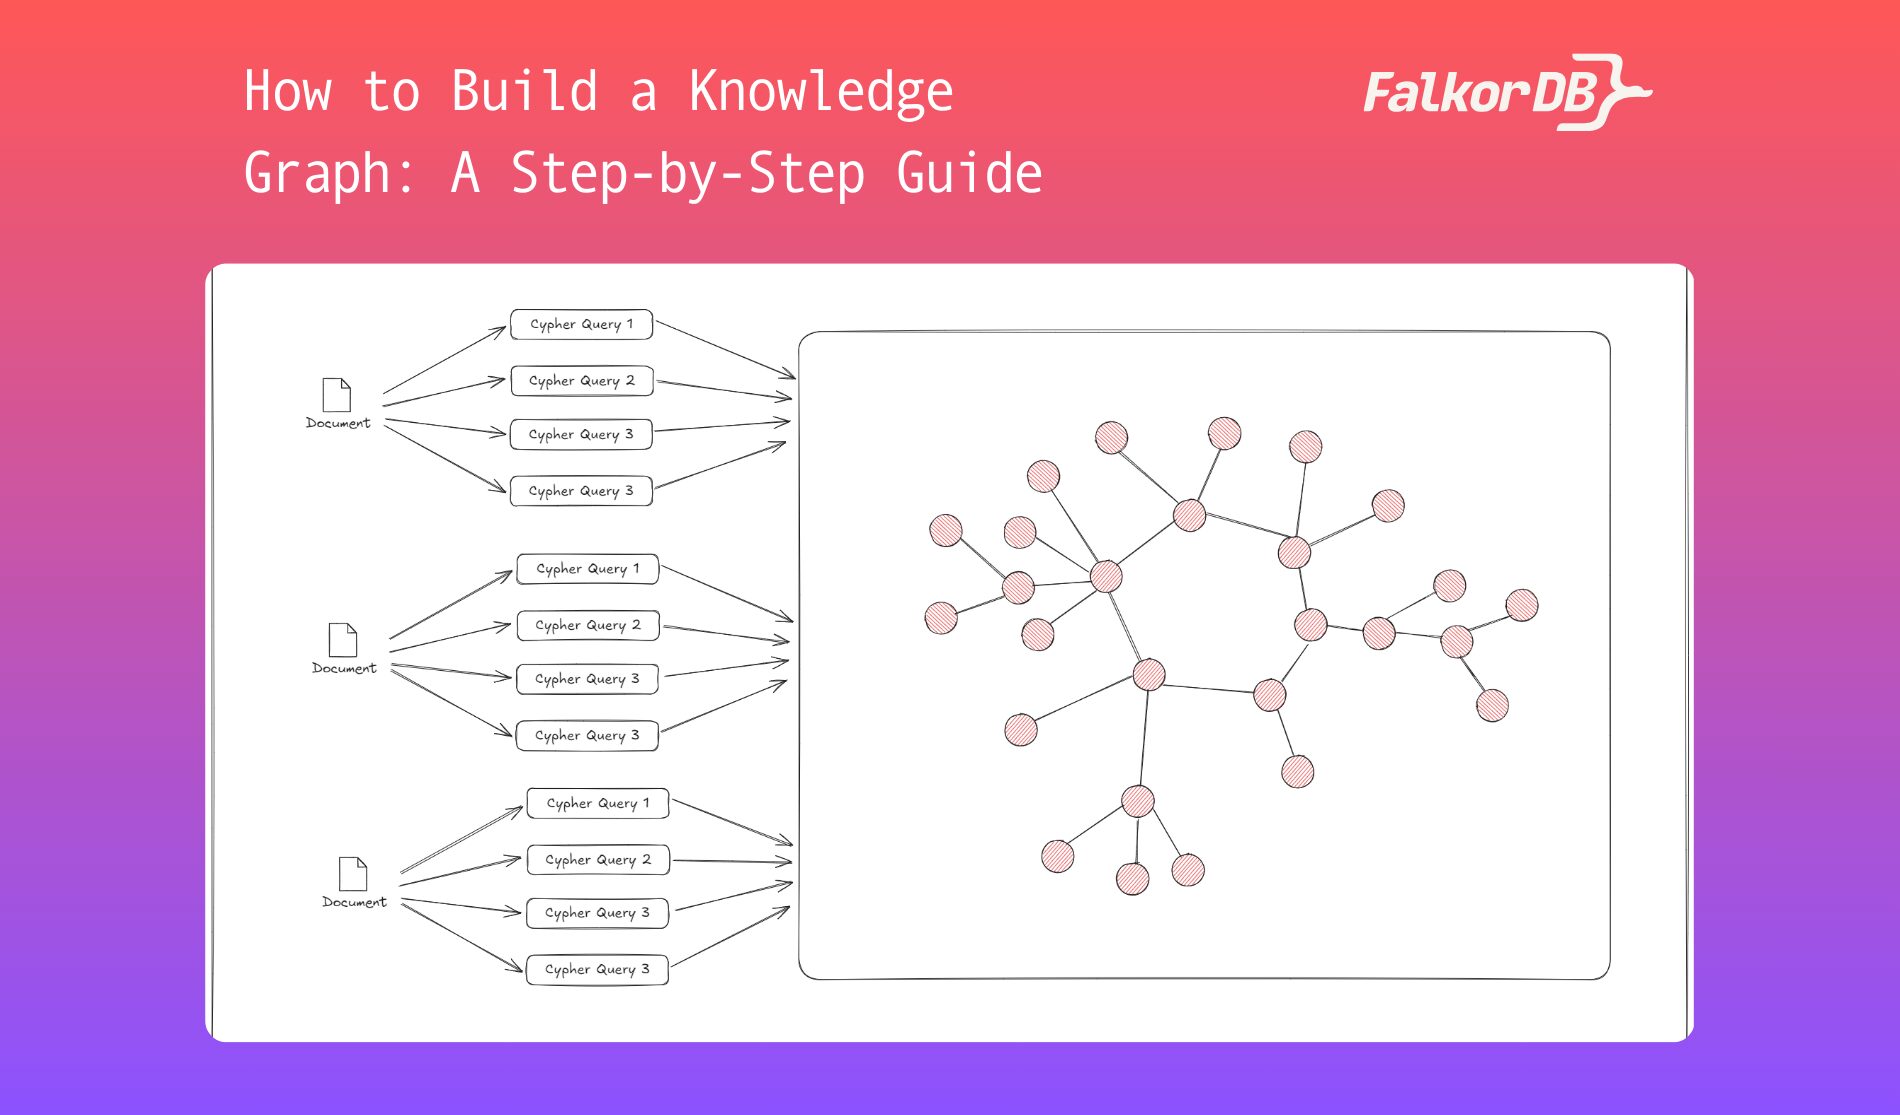
Start with a focus. Are you mapping out a product catalog? A network of academic papers? A supply chain? Knowing your domain helps decide what entities matter and how they connect.
This is your raw material. Pull in people, places, terms, concepts—anything that plays a role in your context. Then draw out how they link. Who reports to whom? Which paper cites which? What product is related to what feature?
There’s no shortage of tools—Neo4j, RDF stores, or frameworks built on SPARQL or OWL. The decision depends on how you plan to use your graph. Do you need fast queries? Complex logic? Something that connects with your current systems?
Raw data is messy. Names don't match, duplicates show up, and formats shift. Before building the graph, clean up your inputs. Normalize names, remove redundancies, and structure data points into consistent formats.
It’s not just about connecting A to B. You’ll need to define how things relate. Is it “owns,” “founded by,” “cites,” or something else? Once your schema is in place, you can map real data into your framework.
This is what separates a graph from a list. Use existing ontologies—or create your own—to define the context around your nodes and edges. This helps systems interpret the data properly.
Graphs aren’t static. As new data comes in or relationships evolve, your graph will too. Set up processes to regularly update, validate, and improve its structure.
At its heart, a knowledge graph is about making sense of complexity. It turns scattered data into something structured, interconnected, and smart enough to respond with relevance. It's not flashy. It's not loud. But it’s changing the way we interact with information—one connection at a time.
Advertisement
Learn how to simplify machine learning integration using Google’s Mediapipe Tasks API. Discover its key features, supported tasks, and step-by-step guidance for building real-time ML applications
Looking for the next big thing in Python development? Explore upcoming libraries like PyScript, TensorFlow Quantum, FastAPI 2.0, and more that will redefine how you build and deploy systems in 2025

Improve automatic speech recognition accuracy by boosting Wav2Vec2 with an n-gram language model using Transformers and pyctcdecode. Learn how shallow fusion enhances transcription quality
Explore Proximal Policy Optimization, a widely-used reinforcement learning algorithm known for its stable performance and simplicity in complex environments like robotics and gaming
Discover how Google BigQuery revolutionizes data analytics with its serverless architecture, fast performance, and versatile features
How accelerated inference using Optimum and Transformers pipelines can significantly improve model speed and efficiency across AI tasks. Learn how to streamline deployment with real-world gains
How explainable artificial intelligence helps AI and ML engineers build transparent and trustworthy models. Discover practical techniques and challenges of XAI for engineers in real-world applications

How BERT, a state of the art NLP model developed by Google, changed language understanding by using deep context and bidirectional learning to improve natural language tasks
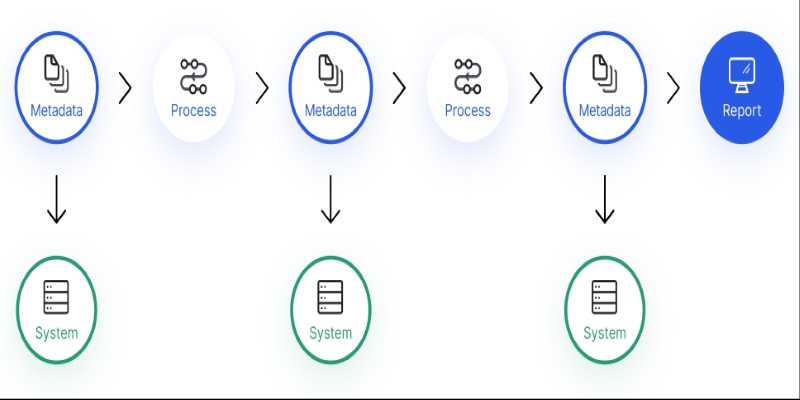
Confused about where your data comes from? Discover how data lineage tracks every step of your data’s journey—from origin to dashboard—so teams can troubleshoot fast and build trust in every number
Wondering how Docker works or why it’s everywhere in devops? Learn how containers simplify app deployment—and how to get started in minutes
Learn how Redis OM for Python transforms Redis into a model-driven, queryable data layer with real-time performance. Define, store, and query structured data easily—no raw commands needed
How Sempre Health is accelerating its ML roadmap with the help of the Expert Acceleration Program, improving model deployment, patient outcomes, and internal efficiency